A tool that can be filtered, sorted, and serached to help educators and administrators understand the performance of their orientation program and identify future opportunities.
The Review Dashboard can only pull data from one Affiliate (filter highlighted green) at a time however it can display multiple roles. There are filter dropdowns at the top of the page setting the start date (highlighted blue) for the data to be displayed. Links to the various sections of the report are hlighlighted in orange that will float at the top of the window as the user scrolls down.
Review Dashboard Data is organized into five display groupings:
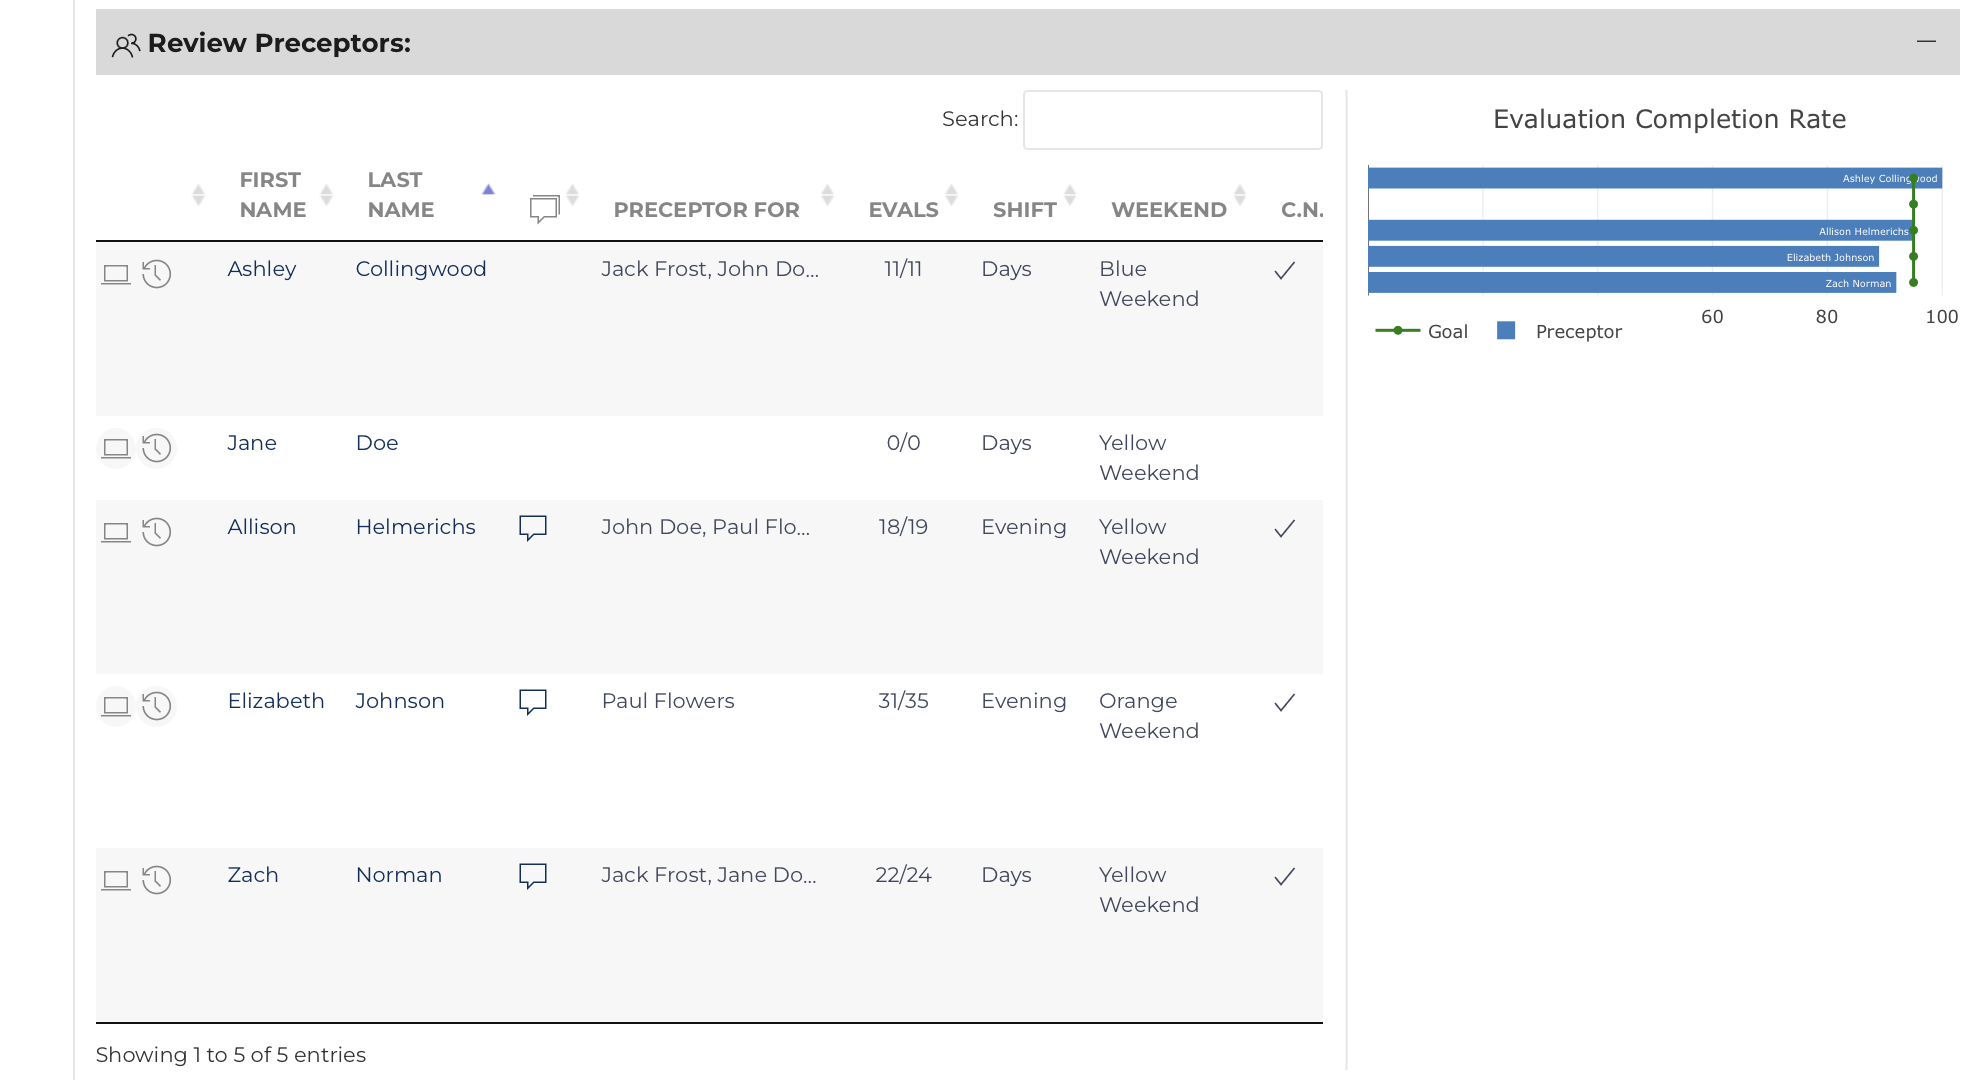
- displays evaluation completion rates for the filtered time period. It also provides links relative to the user profile to Preceptor Pages, Transcripts, etc. It also highlights to a Leadership users if the Preceptor has comments on their profile that should be reviewed prior to performance appraisals.
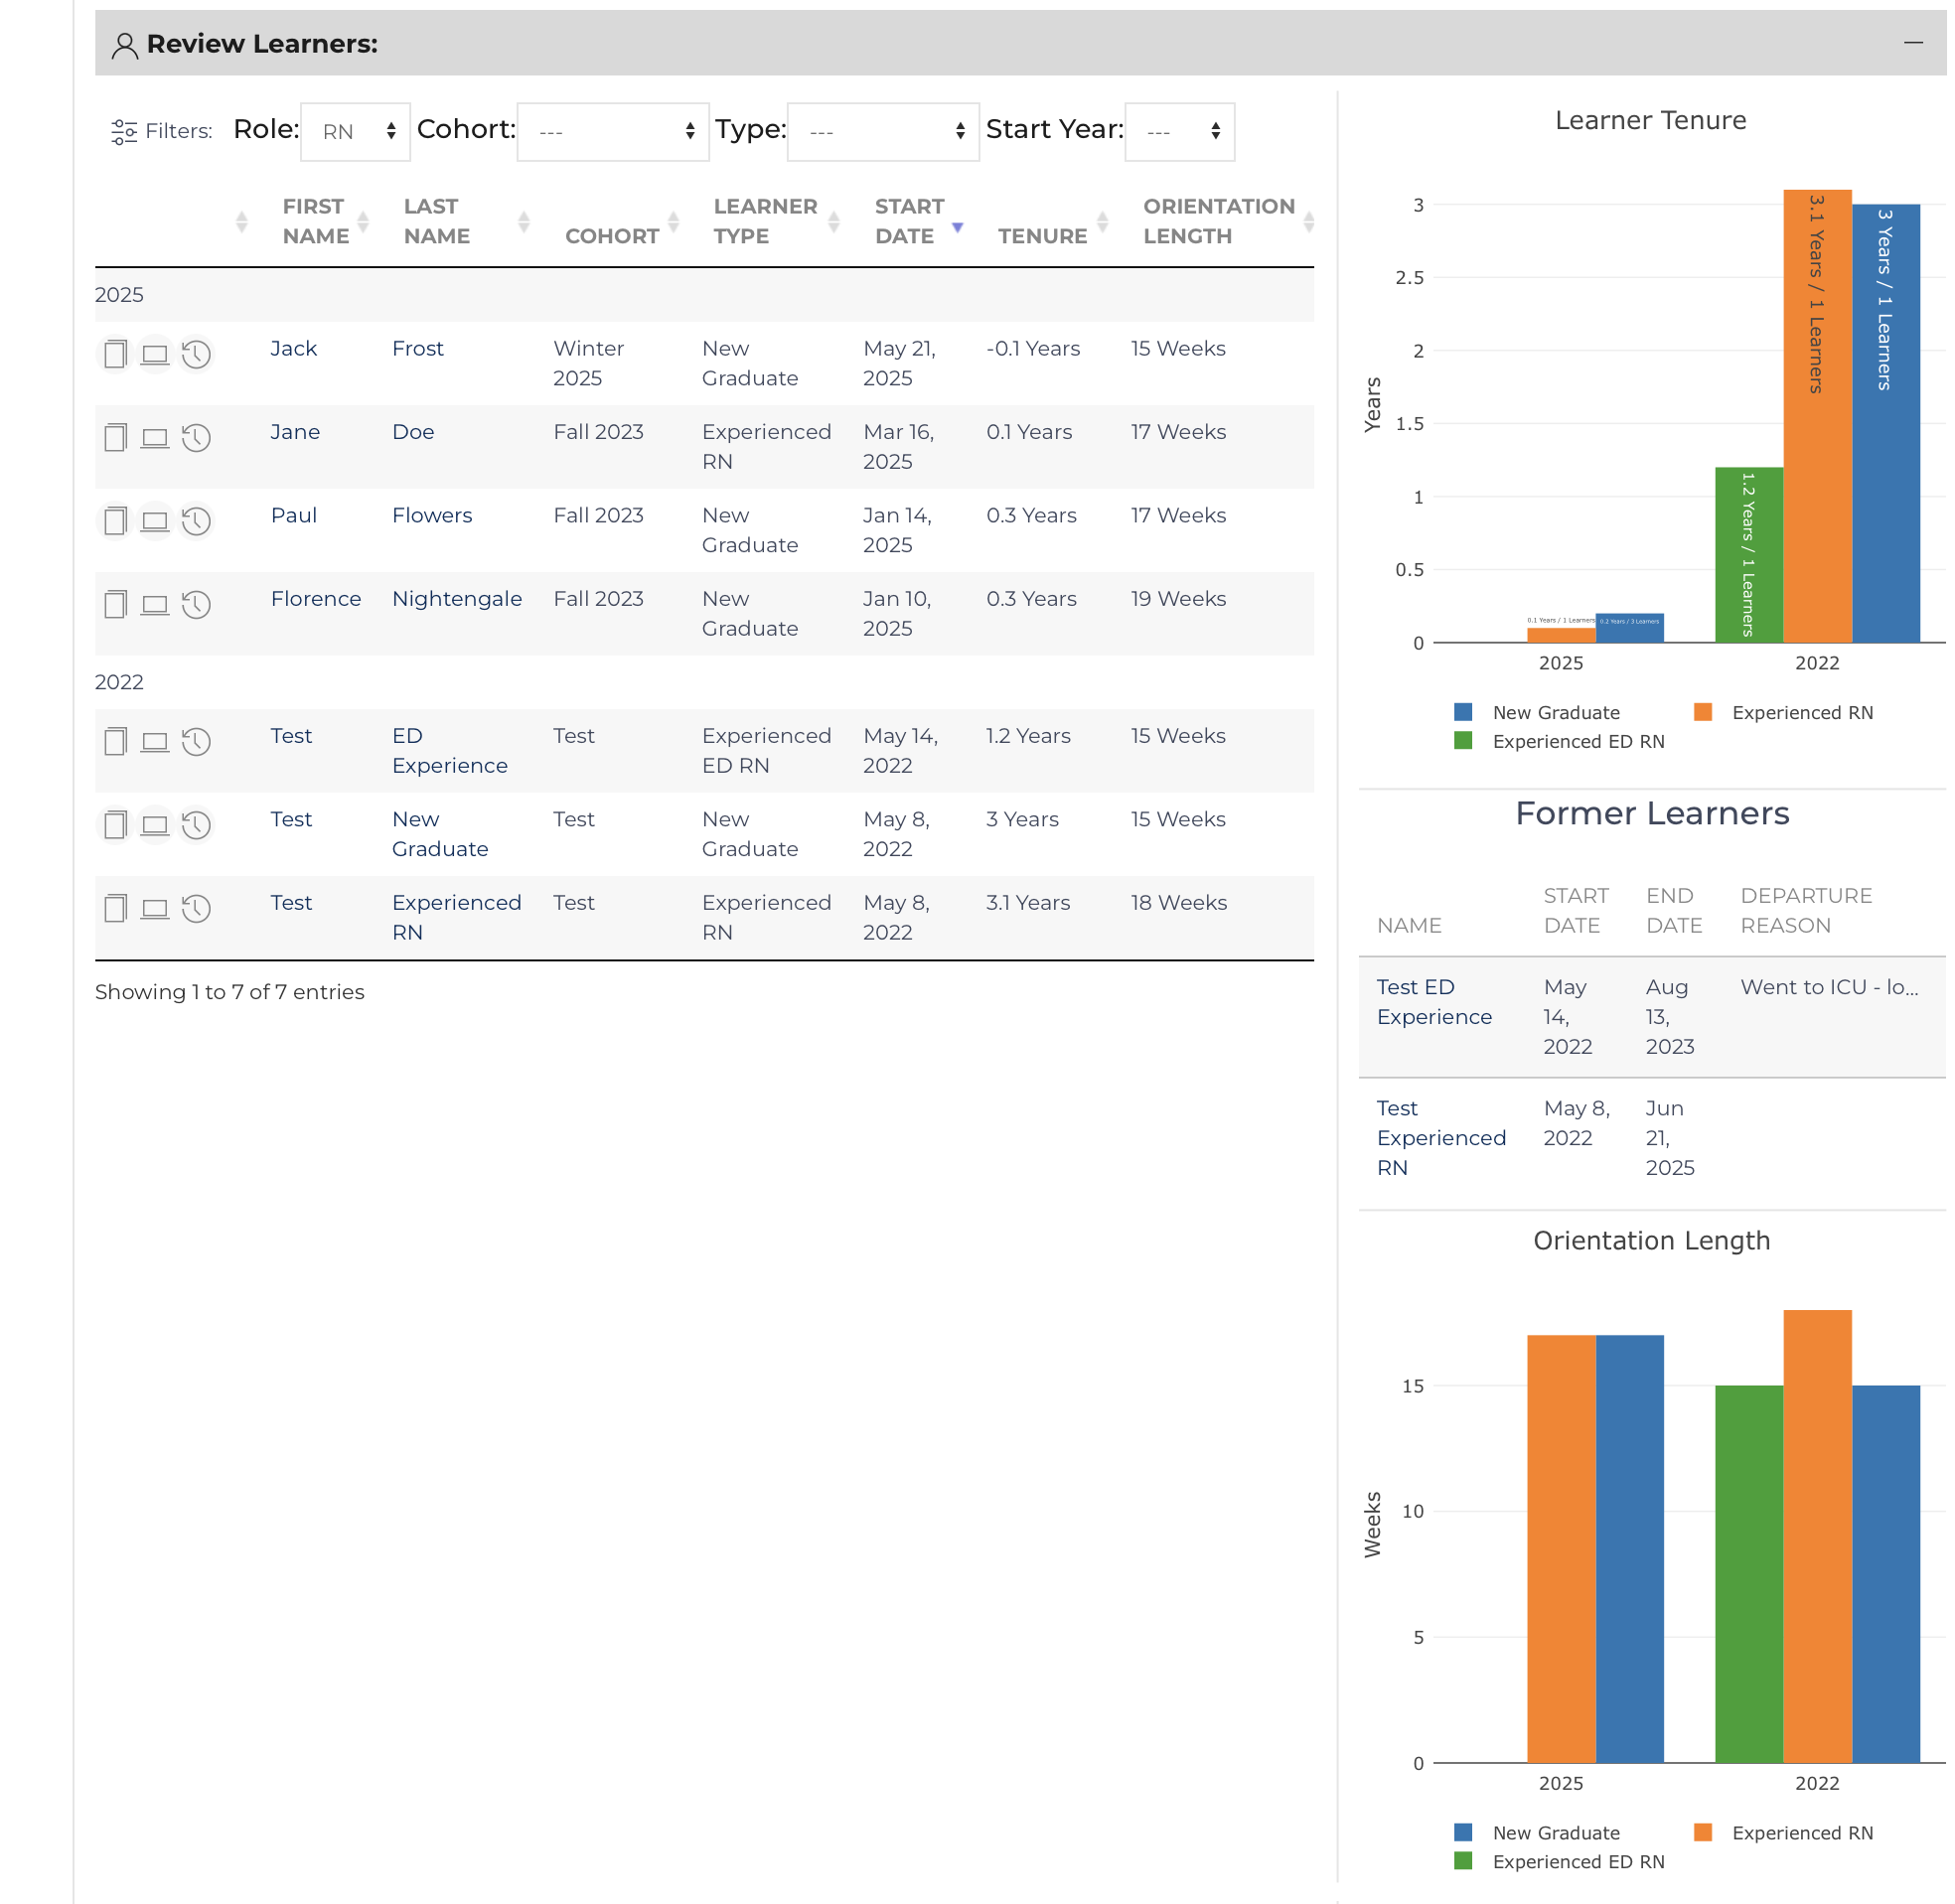
- displays learner data (cohort, type, tenure, orientation length) along with graphs displaying tenure and orientation length. There are links relative to the user profile to bring the user to other Site Views to further examine an individual’s progress.
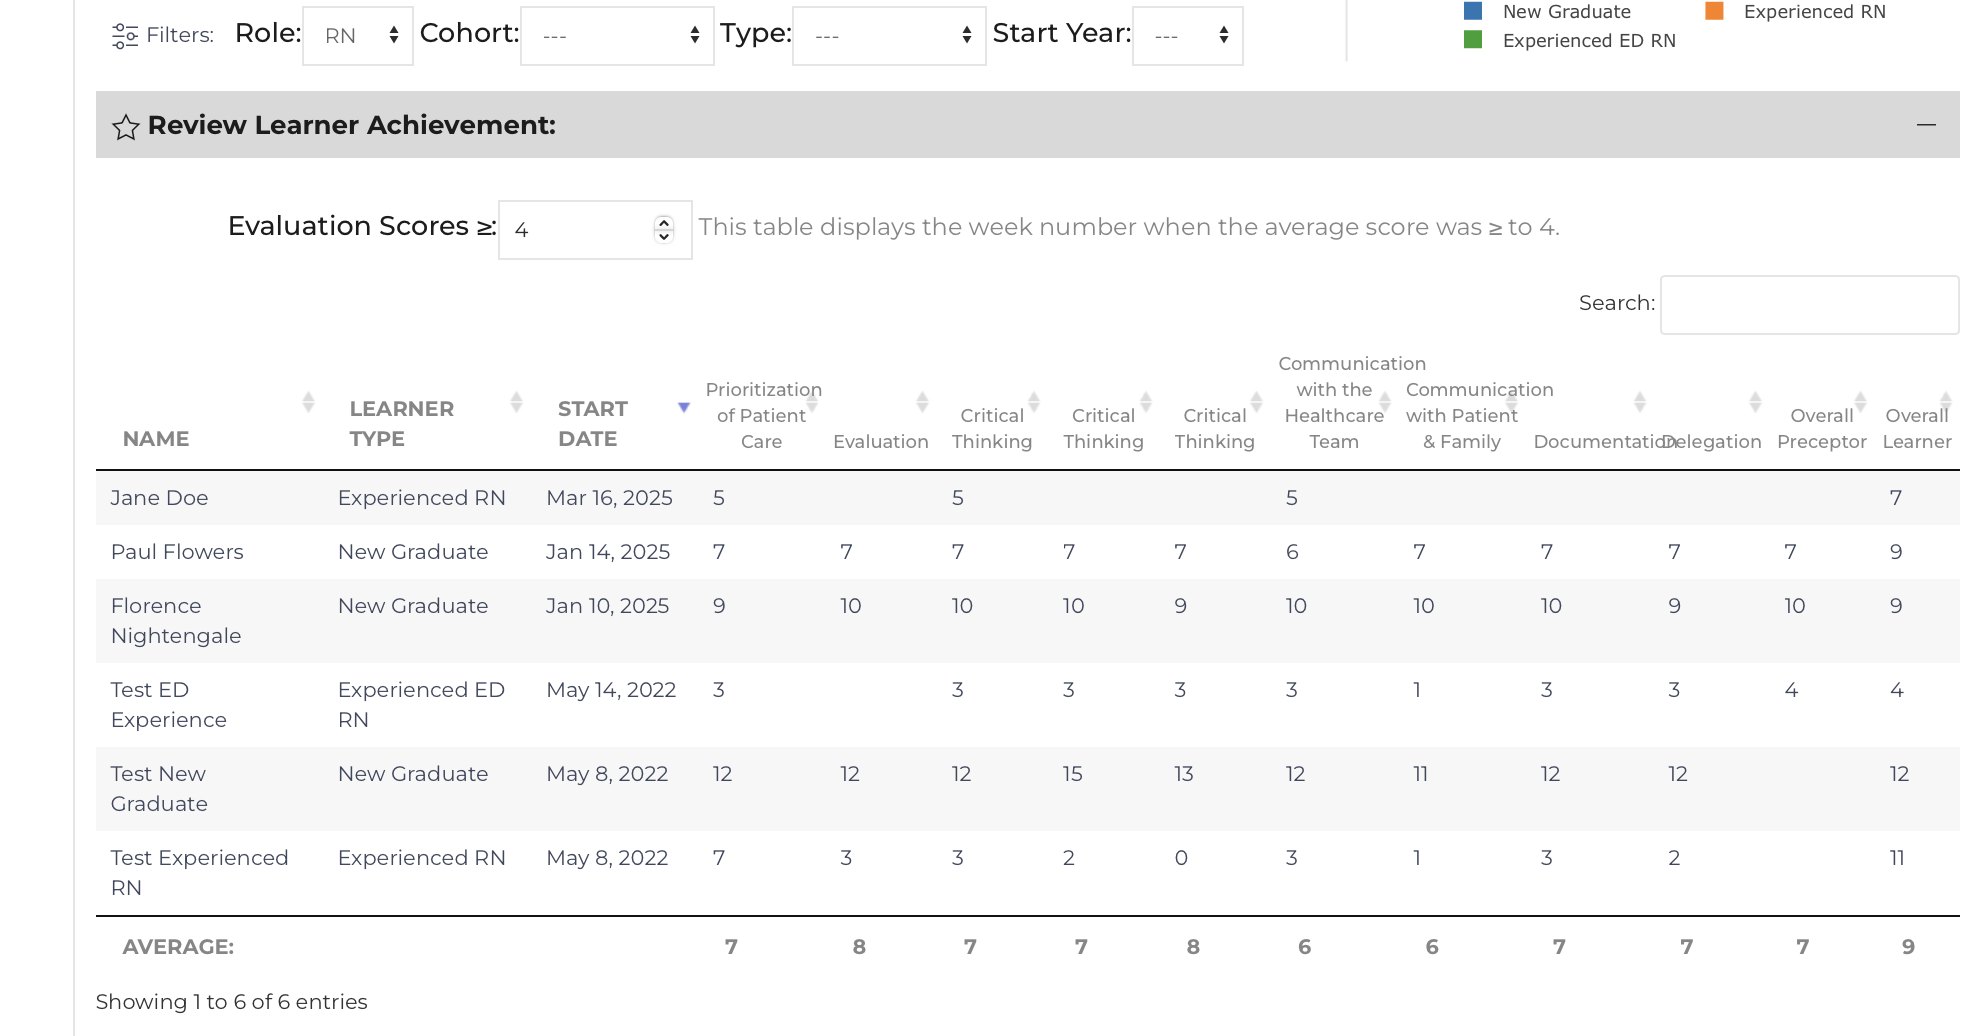
- displays a table that details which week a Learner achieved 80% of the maximum score on their daily evaluations.
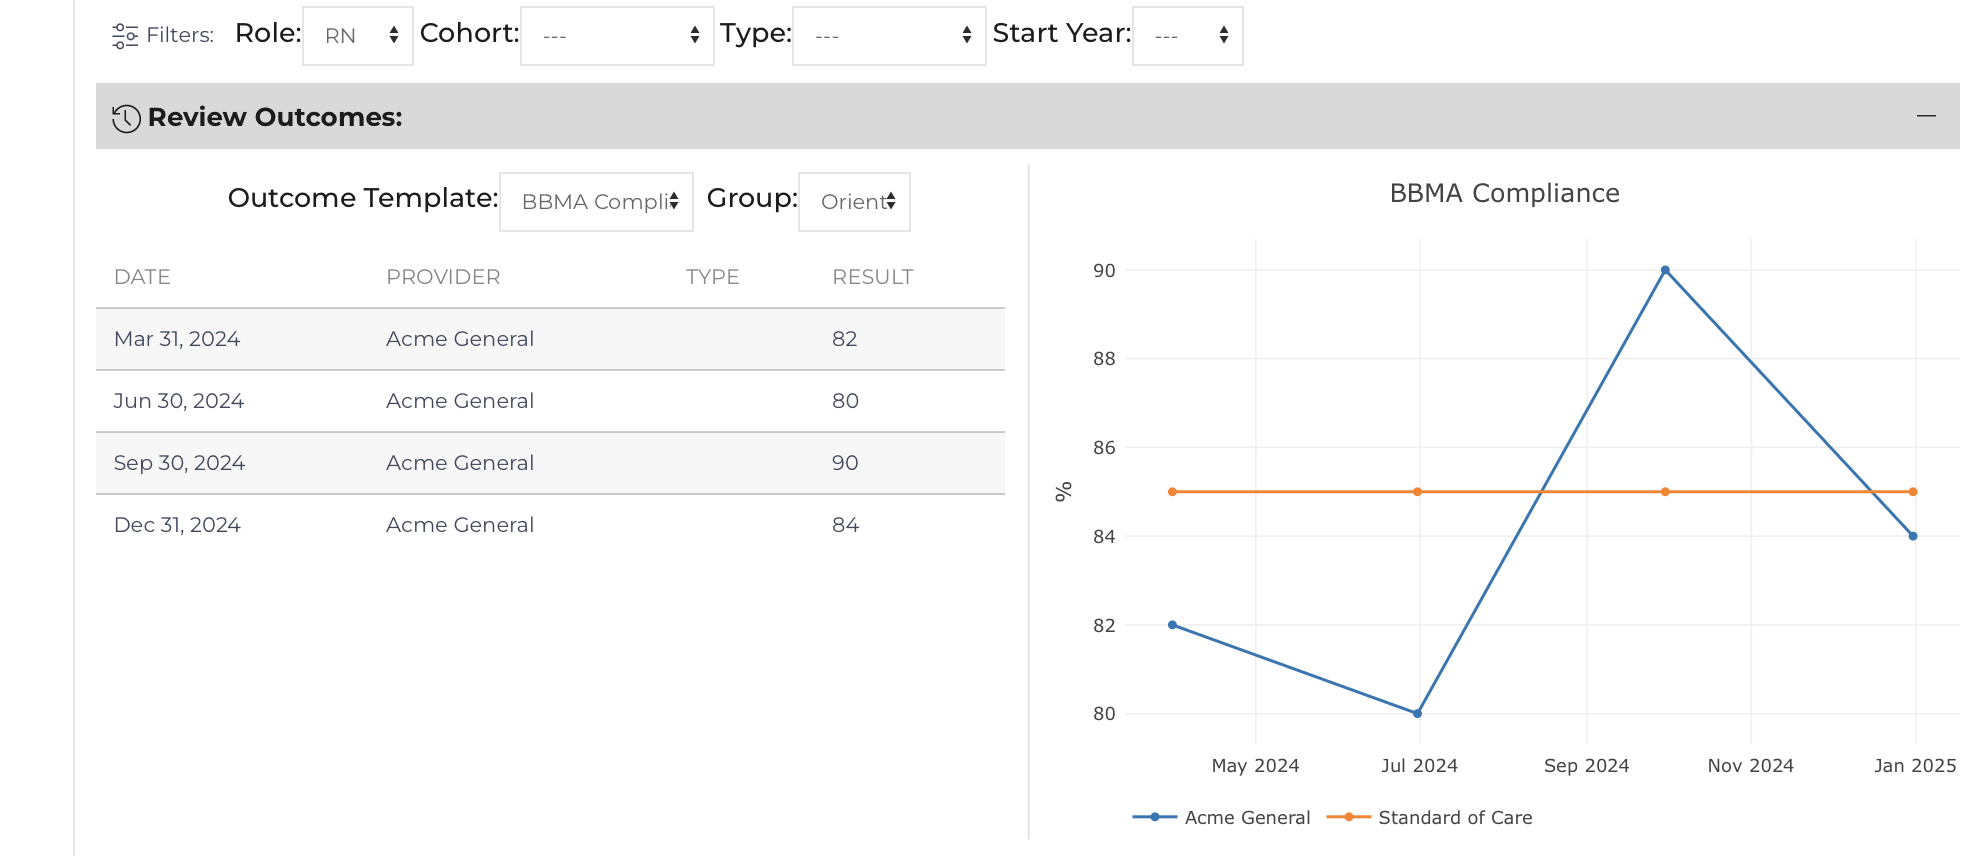
- displays a given outcome for the learners that have been filtered in this list with a graph displaying the data.
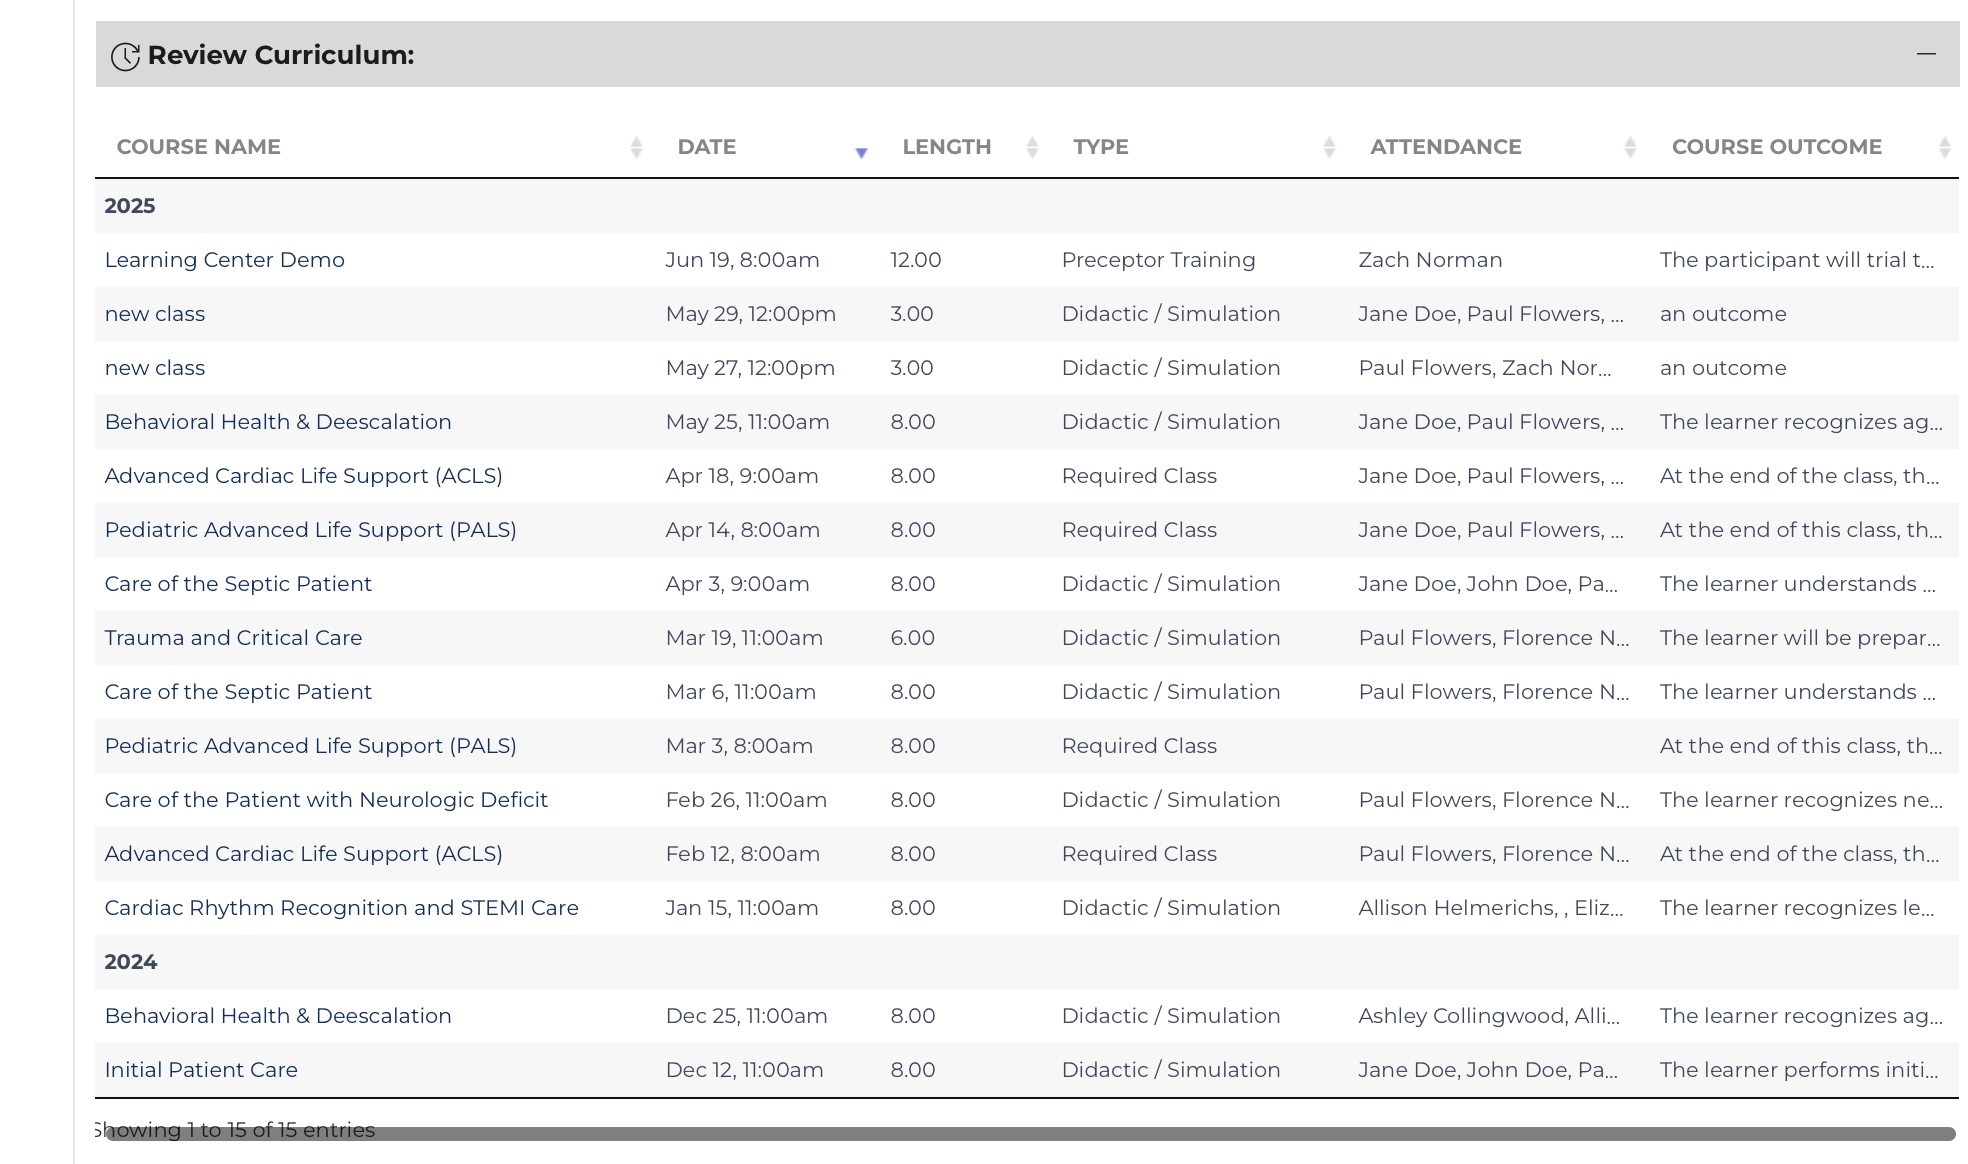
- displays a list of courses that were offered in the filtered time period, the attendance, and course outcome.
Preceptors
The preceptor list displays evaluation completion rates for the filtered time period. The list shows all preceptors not just preceptors who have been a preceptor during the filtered time period. The list can be reorganized and has a search function. It also provides links relative to the user profile to Preceptor Pages , Transcripts , etc. It also highlights to leadership is a Preceptor has comments on their profile that should be reviewed prior to performance appraisals.
The graph allows a visual representation of evaluation completion.
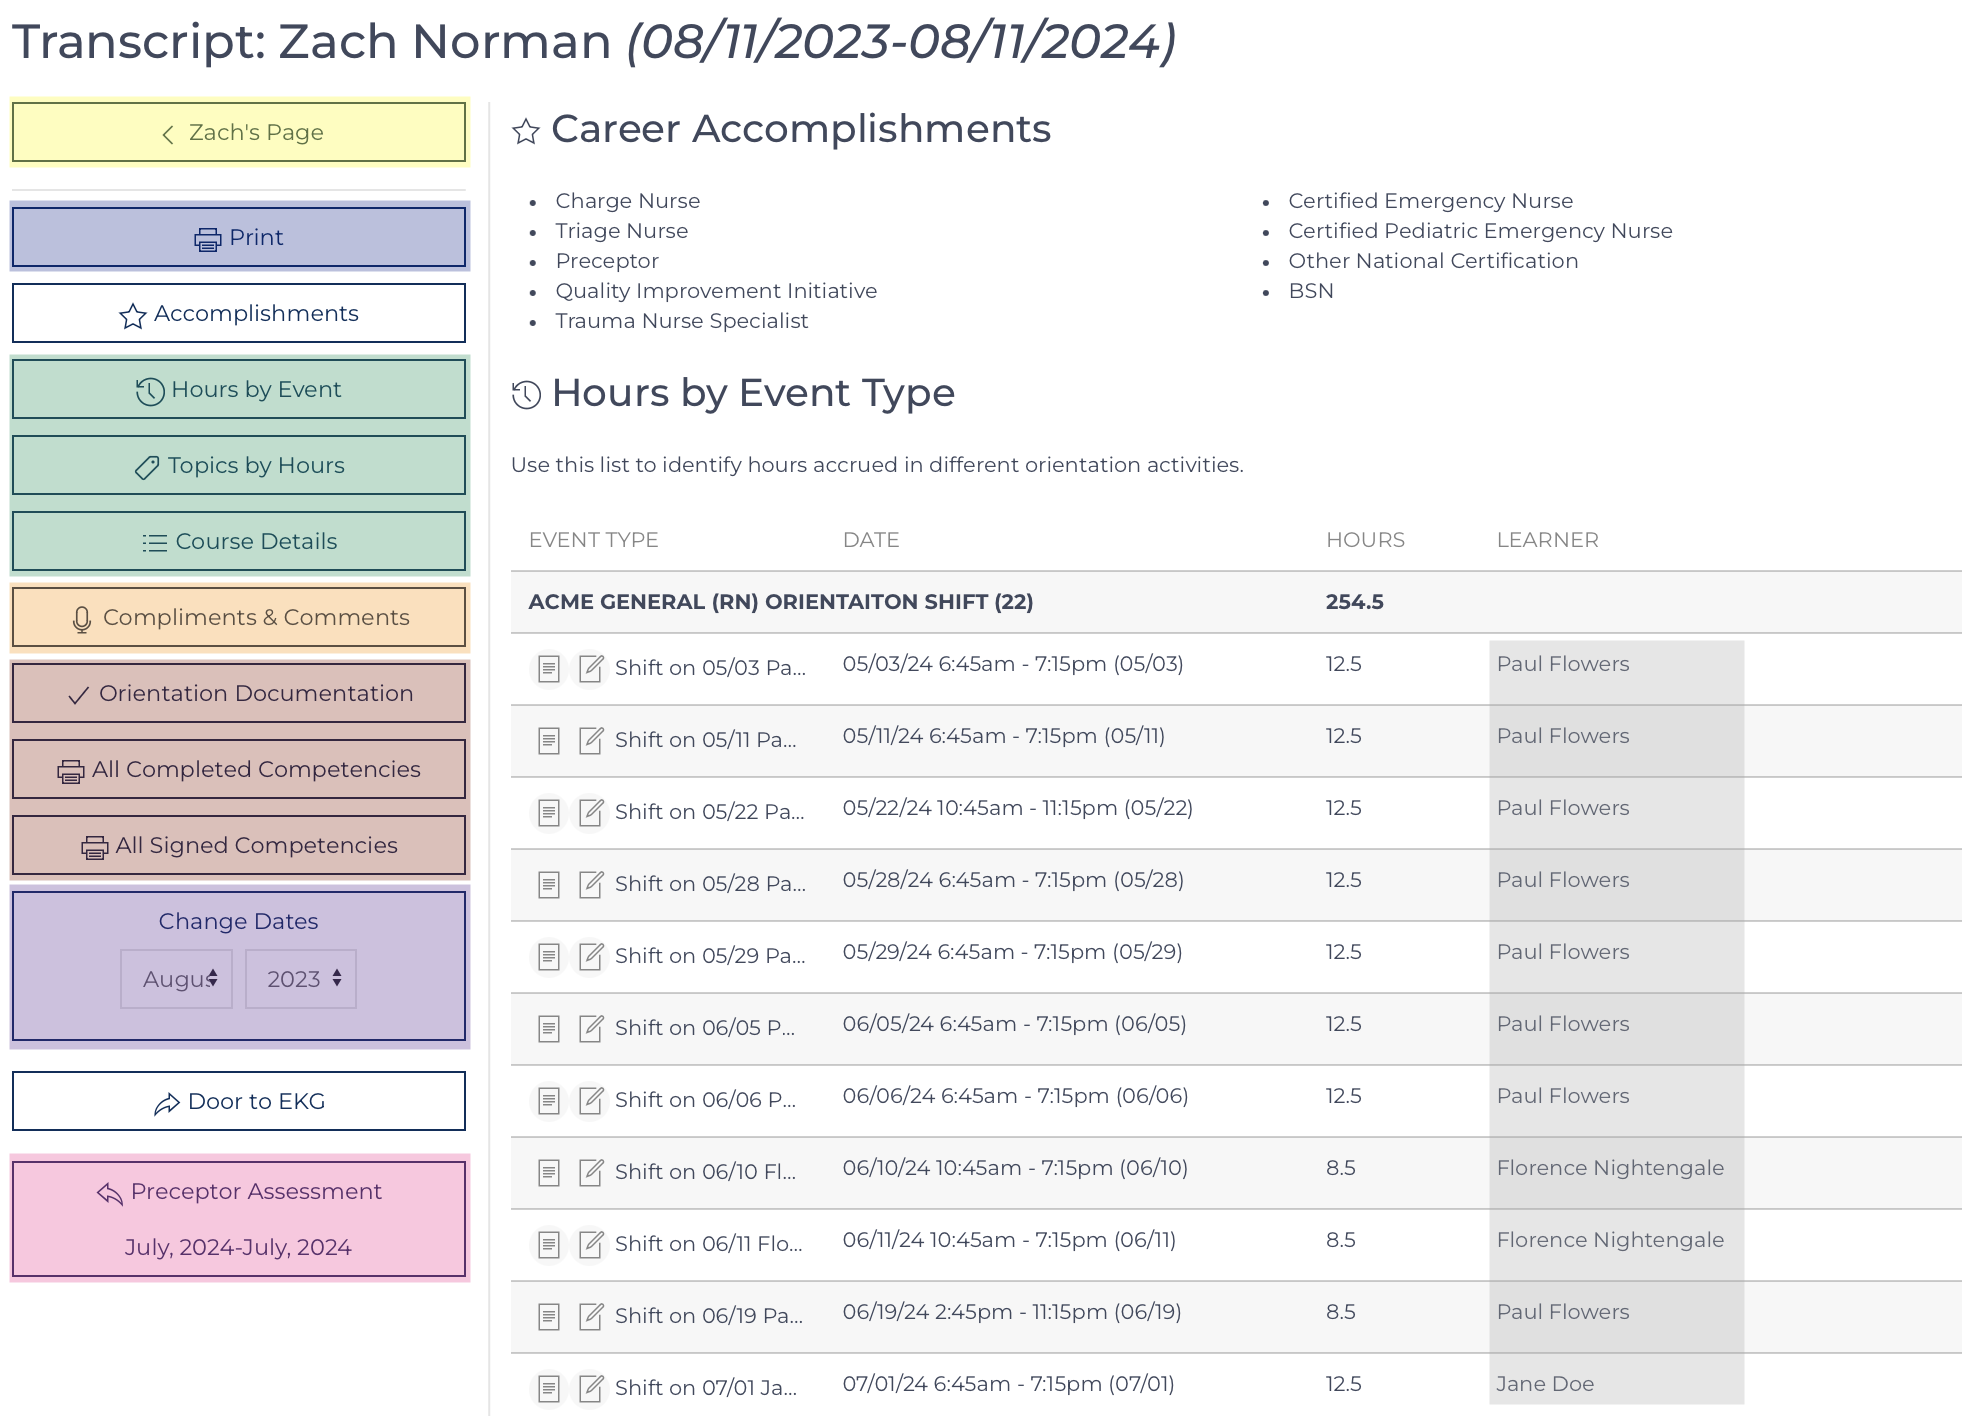
The Preceptor Transcript is highlighted in figure to the right. It includes shifts, learning events, topics covered during a shift, training attended / courses that the preceptor helped teach, preceptor comments and links to documented outcomes.Learners
By default, the filters are set blank, however the list can be focused on Learners with a specific role, cohort, type, and year they started in the affiliate. 
This list ignores the “Start Date” filter displaying all Learners that have been a part of this Affiliate. However, the start year filter can be applied. When each of the filter drop downs are changed, the page refreshes to apply the filter automatically. The Learner filters are applied to data shown Achievements and Outcomes Lists.
This list displays learner data (cohort, type, tenure, orientation length) along with graphs displaying tenure and orientation length. There is also a list that displays learners who have left the organization and why.
There are links relative to the user profile to bring the user to Learner View / Leader Review , Learner Public Site View , and transcript . This list can be re-organized using the column titles.
Learner Achievements
The filters from the Learner List are also applied to display Achievements of the Learners within a specific role, cohort, type, and year they started in the ED. There is an additional filter for this section that by default is set to 80% of the maximum score for items on the Daily Learner Evaluation. 

Each Learner is displayed and shows the week when their average score for the given topic was achieved[1]. If there isn’t data available, the learner has not achieved the target level within the given category. There is an average row at the footer of when learners tend to acheive.
There are lots of variables that may impact when a learner is able to acheive including the subjective nature of the evaluations, patient acuity, and various preceptors. Interventions to combat this include standardized training for the evaluations and direct observations of care to validate the acheivement using the Clinical Development Grid.
Outcomes
The filters from the Learner List are also applied to display Outcome of the Learners within a specific cohort, type, and year they started in the ED. There is an additional filter for to choose an Outcome to be displayed. By default, this drop down is blank. 
 Choose any outcome measure on the list and if there is data available for the filtered users it will be displayed.
This list and displays a singular outcome for the learners and the Affiliate data. Further evaluation of Outcomes and related interventions can be reviewed in the Outcomes section.
Curriculum
This list displays a list of courses that were offered in the filtered time period, the attendance, and course outcome. Hover over each column to see the full text.
Data Analysis
There are additional buttons in the floating links located at the top of the page to facilitate further data analysis.
Returns the dashboard back to the default settings. Useful if various filters have been applied and counter eachother. This page is a data review and is not manipulating any data.
Some data may be cut off when printing. The graphs can be saved individually but will not print as they become distorted.
Each of the five tables will be exported to it's own tab in an excell document. This is an adjunct to save filtered data to a spreadsheet, use the export functions for further data analysis of the complete datasets.

